
Online marketing data informs all the decisions, which is why Client Reporting Tools have become essential for agencies. Among agencies, managing data may also become a major issue. It is possible that you are handling Facebook advertisements, Google Analytics, search engine rankings, and email metrics of numerous customers. In case you continue to enter numbers manually in spreadsheets instead of using Client Reporting Tools, you are wasting your time and money.
Client reporting has become essential for retaining clients, which is why modern agencies now treat it as a standard requirement. Studies show that 88 percent of companies use AI and automation in at least one area of their business, a trend that is especially common among agencies managing reports at scale. Without proper automation, an average agency can spend 5–10 hours per month manually preparing reports for just one client. Multiply that by 20 or 50 clients, and the time investment grows rapidly, creating inefficiencies and unnecessary workload.
Research indicates that the time spent on data collection can be reduced by up to 80 percent with the right reporting tools. Manual work time drops to just 15–30 minutes per client when automated reporting is in place. According to a 2025 survey, 64 percent of respondents said that advanced reporting and AI-driven insights were key drivers of innovation. Before overworking employees, choosing the right Client Reporting Tools may be the most important decision of the year if your agency wants to clearly demonstrate its return on investment.
What Are Client Reporting Tools?
Client reporting tool is a software that gathers information on numerous marketing outlets, social media, search engines, CRM, etc. and transforms them into simple visual reports. The tool is the one central location instead of your team having to log-in to numerous sites to view the results of a campaign.
It works like a translator. On the one hand, one can find technical information, raw numbers, API codes, complicated spreadsheets. Your client is on the other end, and he or she simply wants to know whether his or her investment is worthwhile. Reporting tools fill such gap. They transform raw data into easily understandable charts, graphs and summaries making them understandable by a non-technical individual.
Why Agencies should have Client Reporting Tools
A plain PDF could suffice in case you are a single freelancer and have a single client. However, a developing agency must have such tools because of three reasons:
1. Scale Your Business
An agency cannot grow when account managers are working on spreadsheets instead of Client Reporting Tools. Automation through Client Reporting services will allow you to take the same effort to satisfy 100 clients as you previously did to satisfy 10.
2. Professionalism and Trust
A branded dashboard created through Client Reporting software that is cleaner and contains your logo appears far more professional as compared to an untidy Excel sheet. Clients receive a high-quality report and get more convinced about the prices you set.
3. Real‑Time Transparency
The majority of Client Reporting Tools have live dashboards. Clients will be able to view the performance of ads anytime rather than waiting till the end of the month.
The 10 Best Client Reporting Tools for Agencies for 2026
1. Google Looker Studio
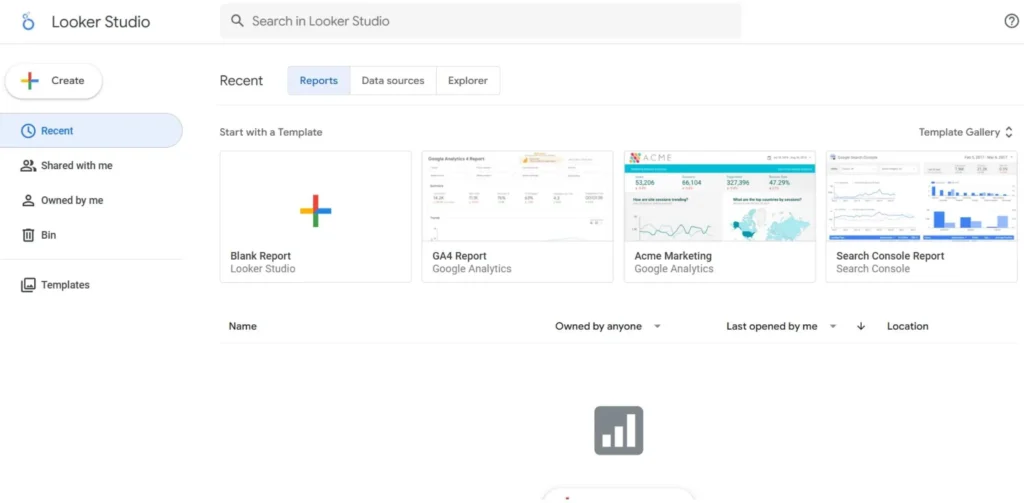
Looker Studio (formerly Google Data Studio) is a widely used reporting application and one of the most popular options because it is free and integrates seamlessly with Google applications. It operates in the cloud and allows users to transform data into easy-to-understand, shareable dashboards. For agencies, it functions like a blank canvas where charts, graphs, and maps can be created using simple drag-and-drop features.
Key Features
- Funky interactive dashboards that have filter buttons that can be clicked.
- First-mover relationship to all Google marketing tools.
- A large number of community templates.
- Has the ability to integrate reports in web or internal pages.
- Calculated and advanced raw fields.
Pros
- Free for the basic version.
- There are no reports or viewers limits.
- Live team work such as Google Docs.
Cons:
- Advanced visuals are very difficult to master.
- Connector tools (e.g. Supermetrics) that are non-Google are paid by needs.
- Slow with large sizes of data.
Pricing: Free The Pro version begins at 9 users/month.
Best For: Smaller and middle-size agencies that primarily deal with Google marketing and have stringent budgets.
Website: https://lookerstudio.google.com/
2. Databox
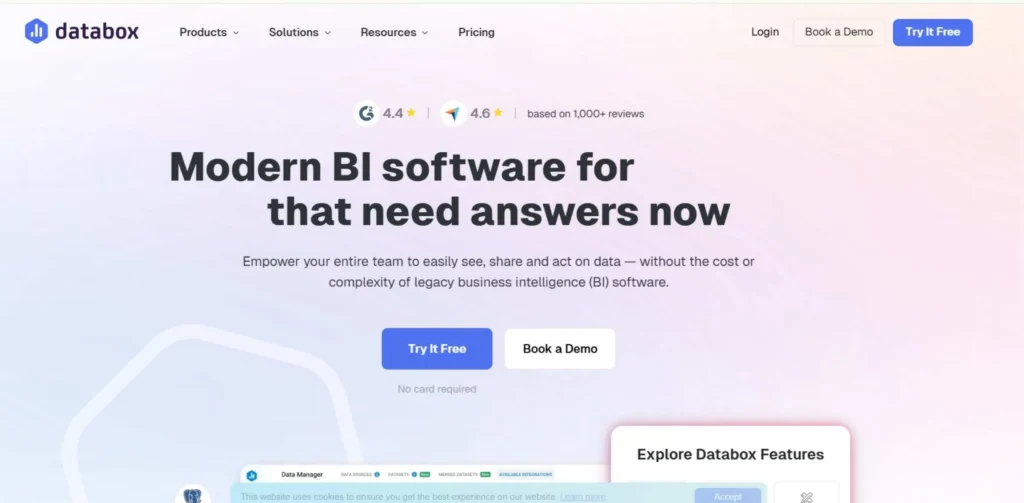
Databox is an updated business intelligence application and one of the fastest growing Client Reporting Tools designed to fit the needs of agencies that require immediate responses rather than hours of work on dashboard designs. Its strong point is that it is aimed at forecasting outcomes and very simple. It takes all your data in a single point and allows you to create Goals and Snapshots to see whether you are working to achieve a target of a client by the middle of the month.
The app is highly visual and can be used on phones and tablets, and even on the Apple Watch, an app is available to track key numbers when you are out. With Databox, you can choose more than one thousand templates when creating its charts (compared to other tools that require you to create charts manually).
Key Features
- Goal Tracking to monitor the progress relative to client KPIs.
- Over 130 inbuilt integrations with well-known promotional applications.
- Dashboards available wherever one is.
- Office television loop dashboards.
- Scorecards sent to Slack or Email.
Pros
- Extremely quick installation featuring ready-made dashboards.
- Great mobile experience.
- Inbuilt Benchmark application so as to compare clients with industry standards.
Cons:
- The free version is extremely restricted (maximum 3 data sources).
- It becomes more expensive with increasing clients.
- Less customizable than Looker Studio.
Pricing: Free plan available; the cost of paid subscriptions starts at $47/month.
Best for: Rapidly expanding agencies that desire a plug and play product with good goal tracking.
Website: https://databox.com/
3. Agency Analytics
The only platform on this list that can be made specifically for marketing agencies and one of the most agency-focused Client Reporting Tools is AgencyAnalytics. Since it addresses a single niche, all the features are selected to address the issues that agencies have. It also integrates automated report reports with SEO tools such as a rank tracker, site auditor and backlink monitor and hence you no longer need the additional tool to monitor keywords.
The interface is highly clean and can be white-labeled and allow you to provide customers with their own log in which they will view data under your brand. You can develop different campaigns for each customer and can easily toggle between SEO, PPC, Social Media, and Email Marketing tabs. It also possesses a report scheduler which automatically sends nice PDF reports to the clients on weekly or monthly basis.
Key Features
- Completely white-labeled client portals and mobile applications.
- Inbuilt SEO solutions (rank tracker and site audit).
- 75+ marketing integrations, such as special ones such as CallRail.
- Goal bars will be used to indicate the proximity of clients to targets.
- Drag and drop dashboard as customizable.
Pros
- All the tools needed by an agency under a single subscription.
- Customer care that is great and familiar with agency owners.
- Extremely intuitive; minimal training is required by new employees.
Cons:
- No free indefinitely version (there is a trial only).
- Pricing per campaign can be cumulative to agencies having lots of small clients.
- Less accommodating to non-marketing data visualization.
Pricing: It charges a minimum of 12 dollars per client/month.
Best for: Digital marketing agencies intending to have a single reporting and SEO tracking product.
Website: https://agencyanalytics.com/
4. DashThis
DashThis is designed for agencies that want simple and reliable Client Reporting Tools without complexity. The site is designed to be used by agencies that desire a clean and straight forward method of presentation of data without any fluff. Automated marketing reports are best when you would like to incorporate data of various sources into a single widget.
To take the example of when you organize a Summer Sale campaign on Facebook, Instagram, and Google Ads, DashThis allows you to design a single chart and see all the three platforms combined in terms of the number of clicks. This multi source capability is much easier to operate as compared to most other tools. The report designs are up to date and are presentable to executives.
Key Features:
- Unlimited data sources and users on all plans.
- Clone option to duplicate a report to another client.
- PDF reports which are sent automatically.
- niche or offline data Custom CSV imports.
- Preset widgets of standard KPIs.
Pros
- The least difficult tool to learn among them.
- Superior customer support team which assists in installation.
- Extremely dependable; dashboards can hardly fail unlike other BI tools.
Cons:
- Pricing is calculated according to the number of dashboards, which may be perplexing.
- Lacks a few more data manipulation capabilities of bigger BI tools.
- No inbuilt search engine optimization applications such as rank monitor.
Pricing: It begins with 3 dashboards at $49/month.
Best To: busy agencies that require high quality, automated reporting and do not require a learning curve.
Website: https://dashthis.com/
5. Klipfolio
Klipfolio is a potent data application and one of the more advanced Client Reporting Tools for complex data needs. It allows connecting with nearly any data source via API. This is why it is popular with agencies that handle unconventional clients, including SaaS vendors or e-commerce brands whose backends are custom. Klipfolio currently has two central products: Klips, a highly flexible dashboard builder, and PowerMetrics that provides a simpler method of monitoring metrics over time.
The platform allows intricate formulas and data transformations to enable you to create your data in nearly any way. Another feature of Klipfolio is the strong agency-level partner program where agencies have access to client dashboards and discounts.
Key Features
- Has links to hundreds of integrations and custom API connections.
- Supports using advanced data modelling, building formulas with excel-like logic.
- Proposes white-labeling in order to have total control of design.
- Offers PowerMetrics to track basic historical data.
- Allows multi-dashboard loops in order to have numerous clients simultaneously.
- Highly malleable; demonstrates any possible existing data.
- Agency partners are well supported and trained.
- Begins with a lower price than certain BI tools of enterprise.
Pros
- Highly malleable; demonstrates any possible existing data.
- Agency partners are well supported and trained.
- Begins with a lower price than certain BI tools of enterprise.
Cons:
- Cumbersome learning curve; can require a data individual.
- Klips interface is old-fashioned.
- The construction of sophisticated visualizations is time-consuming.
Pricing: Begins with $99 /month Grow plan.
Best for: Tech-savvy agencies which have to visualize complicated or tailored data sets.
Website: https://www.klipfolio.com/
6. Tableau
Tableau, which is owned by Salesforce, is the gold standard of data scientists and big agencies. It is not just a reporting tool, but a complete data analytics engine. Tableau is able to explore deep into the “Big Data” and discern patterns that the other tools are unable to. It is able to analyze millions of rows of data without slacking. Its visualizations are unanimous; it is possible to make interactive maps, heatmaps, and elaborate flow charts.
Nevertheless, Tableau cannot be learnt within one afternoon. It usually needs special training or full time data analyst. In the case of agencies, the key value is that it deals with extremely complicated client requirements and a reputable image in the business community.
Key Features:
- Massive number of visualizations, such as heatmaps, treemaps, and Gantt charts.
- Real-time and in-memory data relationships of very large data volumes.
- Tableau Public to make data tales public.
- Intensive integration with Salesforce and other CRM systems.
- Natural-language queries powered by advanced AI Ask Data.
Pros
- The most popular data visualization software.
- Processes billions of data units.
- Respected by the enterprise customers.
Cons:
- High cost in comparison with marketing tools.
- Not easily learnt by the common marketer.
- Data has to be extensively cleaned.
Pricing: Tableau creator begins with $75 per user monthly.
Best For: Enterprise agencies that have data departments and have significant client budgets.
Website: https://www.tableau.com/
7. Microsoft Power BI
Power BI is a cost-effective enterprise option in the Client Reporting Tools category and this is the appropriate choice of agencies using the Microsoft world. Power Bi is not new to you in case your agency works with Office 365, Excel and Teams. It is an analytic service of business that provides interactive visualizations and business intelligence and a user-friendly interface that allows an end user to create their own report and dashboards.
Price is its greatest virtue as the Pro version is extremely cheap considering the power that it provides. It retrieves data of hundreds of sources and creates different relational models to connect various tables. It is also simpler to use as compared to Tableau but it has a technical orientation.
Key Features:
- Hopeful data security and enterprise grade compliance.
- New features and connectors regularly every month.
- Strengthy mobile application to view reports on the go.
Pros
- Good price cheap per capita.
- extraordinarily strong data modeling tools.
- Intuitive windows and Excel users interface.
Cons:
- The desktop version is Windows only (MAC users have to use a workaround).
- Feels bulky in comparison to the modern web apps.
- DAX (the formula language of PowerBI) has a steep learning curve.
Pricing: The pro plan is at $10 per user per month.
Best For: Agencies that must deal with corporate clients and require high levels of security and thorough data analysis.
Website: https://powerbi.microsoft.com/
8. Google Analytics 4 (GA4)
GA4 is often used as a foundational data source within Client Reporting Tools; it has emerged as a powerful reporting platform. The Explorations feature also allows agencies to create custom reports directly in Google Analytics. The events are being trailed by GA4 to provide a more detailed picture of the way people interact with a site compared to the previous Universal Analytics.
Agencies use GA4 as the source of correct information related to traffic, conversions, and user behavior. It does not provide the white-label appearance of AgencyAnalytics but it contains the raw data.
Key Features:
- Custom data search exploration reports.
- AI assumptions like the probability of a customer leaving.
- Monitor web and web app data simultaneously.
- See real‑time data.
- Intrinsic connection with Google Ads to measure the ROI.
Pros
- Web analytics tool of industry standards that is predominantly used by most agencies.
- Free for most users.
- Very detailed visitor data.
Cons:
- Hard to use for beginners.
- Data collection may be limited by the privacy laws.
- Simple reports are not as graphic and difficult to disseminate.
Pricing: Free (Enterprise version 360 is a paid one).
Best for: Helpful in agencies that require monitoring of web sites performance and conversions.
Website: https://analytics.google.com/
9. HubSpot
HubSpot connects marketing activity to revenue, making it one of the most valuable Client Reporting Tools for lead generation agencies. Google Ads displays the clicks, whereas HubSpot displays the names and whether the people are going to become paying customers. HubSpot is necessary to agencies that do inbound marketing or lead generation.
It will allow you to create dashboards that track the lead all the way through first click to closed deal. This closed-loop reporting reflects precisely the level of revenue that your marketing generated and this is important to the agencies. The interface is user friendly and drag and drop.
Key Features:
- Displays marketing that is associated with actual sales.
- Displays the actions that resulted in a sale.
- Create Sales Funnel.
- Email and social automatic reporting.
- Raise shared custom dashboards.
- Client feedback and survey report.
Pros
- Easily associates marketing data with sales data.
- Looks valuable to clients.
- Easy to use interface.
Cons:
- High cost for advanced plans.
- HubSpot data is only used in reports.
- The free version does not have sufficient reports.
Pricing: Simple tools can be used free; Professional reports begin at $800/month.
Best for: Agencies in the lead generation and CRM field.
Website: https://www.hubspot.com/
10. Zoho Analytics
Zoho Analytics is a budget-friendly alternative among Client Reporting Tools with strong AI capabilities.It is a member of the giant Zoho ecosystem, comprising all of CRM and finance tools. Zoho Analytics is an underdog to agencies as it provides a lot of capabilities of more expensive programs such as Tableau at a fraction of the price. It even has an Auto-Analysis engine which is capable of automatically generating reports on your data sets with the help of AI.
It also possesses a powerful white-label product, which allows agencies to develop a fully-branded reporting portal to their clients. It is compatible with numerous data sources such as files, URLs, databases, and famous business applications such as Salesforce, QuickBooks, and Zendesk.
Key Features:
- AI assistant, which transforms voice into reports.
- Linked to over 500 applications and databases.
- Teams are able to collaborate on common working spaces.
- Accurate management of the access of information.
- Full brand customization.
Pros
- Extremely cheap to the degree of features provided.
- Intense information combination and preparation software.
- A powerful security, and encryption of data.
Cons:
- The interface is somewhat crowded and technical.
- There are a few marketing integrations that are not as extensive as AgencyAnalytics.
- It has a small learning curve required to use the query table feature.
Pricing: Starts at $24/month.
Best for: It works well in mid-size agencies seeking a low cost alternative to high priced BI tools.
Website: https://www.zoho.com/analytics/
What are the Tools used in Reporting?
Reporting tools in the agency work environment tend to be of three types:
- Direct Platform Reports: These are the reports created in the tool you are using, such as Facebook Ads Manager or Google Analytics. They are excellent in deep diving but they are too complex for most clients.
- Marketing Integration Tools – Applications such as AgencyAnalytics or Dash This will gather marketing data in lots of locations and show it in a well-formatted, client-friendly format. This is the most popular option of agencies.
- Business Intelligence (BI) Tools Heavyweight tools such as Tableau or Power BI are used when analysing complex data that extends beyond marketing such as correlating weather conditions to ice-cream sales.
What Are the 5 Business Reports?
When communicating with clients, you will not be sending only one type of a report. The information required by different people is different. These are the five most widespread ones:
1. The Progress Report
A weekly or monthly report on your progress compared to previous weeks or months. ( e.g. we received 10% more leads this month than last month.)
2. The Analytical Report
This goes deeper into the “Why.” It examines an individual issue or opportunity. (e.g. Why is our conversion rate low on Tuesdays?)
3. The Executive Summary
A one-page report brief to the CEO on the Big picture. They are not interested in viewing each and every click; they are only interested in the ROI and the bottom line.
4. The Audit Report
Typically on the initial turn of a relationship with the client. It identifies what is wrong and what is to be mended.
5. The Forecast Report
Relies on previous statistics to make predictions about the future (e.g., “With our growth expectation of 200 sales now, we project to be at 1,000 sales in December).
Conclusion
Selecting the right Client Reporting Tools is one of the smartest investments an agency can make. Automated reporting tools save teams from the frustration of manual data entry while helping clients stay informed and confident in the work being done.
There’s no reason to spend hours buried in spreadsheets. Instead, agencies can focus on strategies that genuinely grow client businesses. With automated reporting in place, employees are more productive, clients remain loyal, and agencies build a strong foundation for long-term growth.
Whether you choose Looker Studio, AgencyAnalytics, DashThis, or another platform, the goal is the same: clearly communicate performance and prove return on investment. Stop wasting time on reports and start focusing on strategy, results, and scalable growth.
FAQs
Is Google Looker Studio free of charge?
The essence of the version of the Looker Studio is free. Many times you need to pay connectors which extract data from non-Google sites such as Facebook or LinkedIn.
What is the most appropriate tool for a small agency?
The small agencies tend to be better served by AgencyAnalytics or DashThis as they are simple to implement and do not require a full-time data scientist.
Do I require a reporting tool when I have 2 clients only?
This can be done manually, but early use of a tool can assist you in the creation of systems. You can find it simpler to increase the number of clients 2-20, in case you are already automated in your reporting.
Is it possible to white-label these reports?
The majority of professional tools (such as AgencyAnalytics, DashThis, and Zoho) allow eliminating their branding and enabling self-branding and custom URL.